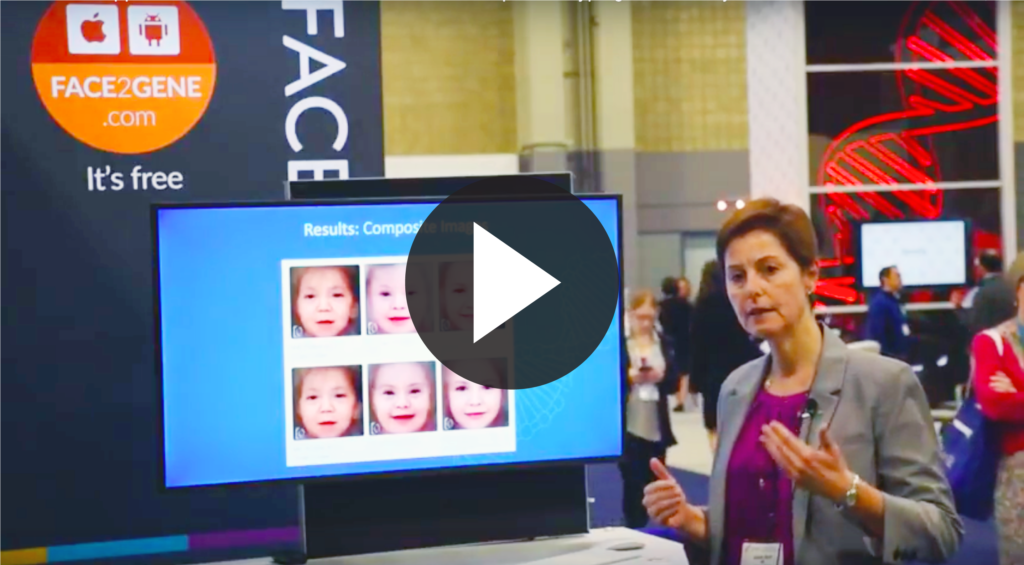
Note: This talk was presented at the 2018 ACMG annual meeting. The video can be seen below, or at this link>
Starting in 1996, a select few clinicians began identifying a small group of patients with similar phenotypic features: Down-syndrome-like facial features, short stature, intellectual disability, cataracts and sensorineural hearing loss. Among these clinicians was Dr. Karen Gripp, who over the next two decades would become one of the namesakes for this MAF transcription factor related rare disease: Aymé-Gripp syndrome (AGS).
In her research, Dr. Gripp (the new Chief Medical Officer for FDNA) asked, “Does Aymé-Gripp syndrome have a facial phenotype that is recognizable using automated facial analysis?” Last week, she shared her investigation at the ACMG annual meeting.
Dr. Gripp used the Face2Gene RESEARCH application to create composite facial images for AGS and for Down syndrome, as well as for individuals with no suspected syndrome.
She ran the analysis twice, using new sets of cases for the Down syndrome and control cohorts for the second analysis to account for the “possibly subtle difference” in averaged facial images.
“There are twenty different images in those cohorts,” Dr. Gripp explained.

Dr. Gripp described the results provided by Face2Gene, including a multiclass comparison that reveals how well the system can successfully classify patients into the correct diagnosis based on facial analysis.

For each analysis, Face2Gene RESEARCH also provides statistics on the performance of the system.
“What you look at here is the mean accuracy for the analysis, and you have to always put that in perspective to the random chance for that particular analysis,” said Dr. Gripp.

Dr. Gripp’s use of the RESEARCH application is easily repeatable by any scientist on their “favorite syndrome.”
First, researchers should upload, to Face2Gene CLINIC, any patients (with at least one frontal facial photo) that they plan to use for research cohorts, being careful to clearly label [in the “case name” field] the study cohort that the patient should be added to, for example: “John Doe, Down Syndrome Cohort.” This makes it easier to find the relevant cases later when creating your study cohorts. If you are interested in analyzing the phenotype distribution for the disease, it is also important to thoroughly annotate a defined set of those phenotypes (present or absent) for every case. Otherwise, just a frontal facial photo for each case is sufficient for the analysis.

Once all the cases are added to Face2Gene CLINIC, you can move to the Face2Gene RESEARCH application by clicking “RESEARCH” in the top right corner of the app. There, you can create a new project, adding the cohorts you want to compare. To do this, select “add cohort,” and select the relevant cases from the list. Repeat for each cohort you want to create, making sure each cohort is roughly the same size.
“If you have a huge imbalance in the cohort size, that by itself introduces a bias,” Dr. Gripp mentioned.
Once cases are uploaded and cohorts are created, users can run their experiment with a click.
“You push the button, you get yourself a cup of coffee; it takes a little bit, literally a few minutes, for the system to run the analysis.”
When the analysis is complete, the user receives an email with summary results and can look in more detail at each item. Results include the sensitivity and specificity reported as the area under the curve of the Receiver Operating Characteristic (ROC) curve, and the p-value to measure significance.
All of the charts and visualizations are easily copied for use in papers and publications by the researcher.
For Dr. Gripp, using the Face2Gene application resulted in the addition of a new syndrome within Face2Gene, paving the way for clinicians globally to better recognize the AGS phenotype in patients through use of Face2Gene–and any researcher with an internet connection can now do the same for other diseases.
Watch the recording of the talk On our Youtube Channel.


